Thoughts on debugging JavaScript, part one
February 23, 2014
Spending the past few months becoming familiar with a large and complex JavaScript codebase has been a learning experience. I have had a few tearing-my-hair-out moments of frustration, but I’ve also become a much more systematic debugger. In the hopes it might be helpful, and also to clarify these things for myself, here are some notes on the topic.
It turns out I have a lot of feelings about browser devtools, so that’s going to be Part One. Part Two will be less specific to debugging JavaScript in the browser, and hopefully more generally applicable.
Befriend your developer tools
Seriously. There are so many useful things hiding in there you probably haven’t discovered yet. I’m not such a devotee that I use the devtools as my editor (maybe someday), but I do pretty much always have them open while I’m working.
I prefer the Chrome tools, mostly arbitrarily, but Safari and Firefox have very similar features. CodeSchool has a free Chrome devtools course that’s helpful for getting started.
In my own debugging, I use the Elements, Network and Console panels most heavily (learning the profiling tools better is on my to-do list).
I think the Elements panel is pretty straightforward and self-explantory, but the Network and Console panels have a lot of hidden functionality you might be unfamiliar with. (And I’m sure they are plenty more things I haven’t discovered yet either.)
Network
The Network panel is useful for answering questions like, “Did this ajax request even happen?” or “What data did I just post to the server?”.
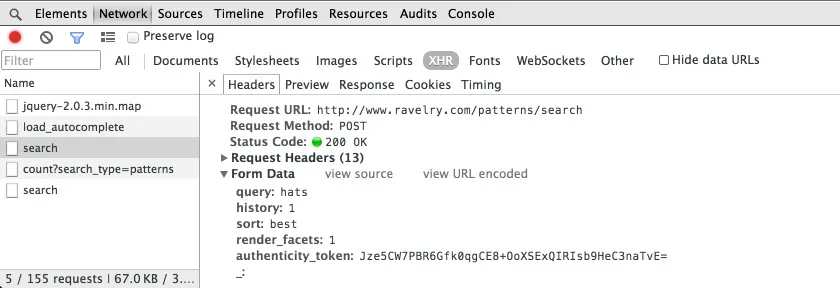
Clicking on a filename in the Name column will open a detail pane with lots of information about your request. It is usually hidden by the expanded-by-default Request Headers section, but the form data passed with the request (something I often want to check) is recorded here. Viewing the server’s response (helpfully under that Response tab) can be useful when debugging too.
Also, I’m filtering the requests by type in this screenshot, limiting it to only ajax/XHR requests. This helps a lot with finding the actual requests you’re interested in, since I don’t particularly care about images if I’m trying to figure out why an ajax request is broken.

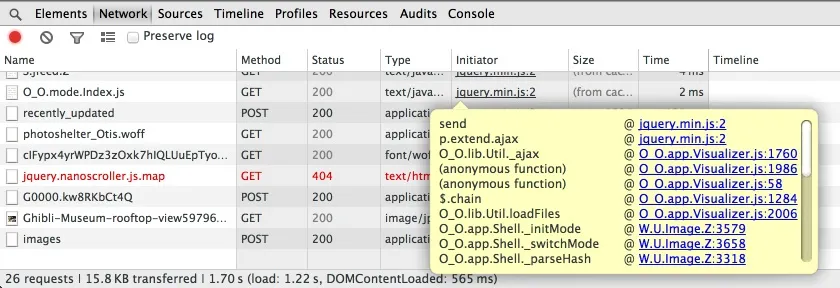
It took me far too long to realize that if you hover over the filename in the Initiator column, you can view a stack trace that shows where an ajax request came from. So here’s a screenshot of that, too, so you don’t have to discover it accidentally like I did.

Console
I use the console a lot for trying out and troubleshooting small pieces of code, but it can also be useful if you’re trying to understand an unfamiliar codebase.
If there is a class (or jQuery plugin, or whatever) whose behavior seems mysterious, trying to use it and poking around in its properties from the console can often help clarify things. (If the class in question is inside a module or otherwise out of scope, I’ll edit the code temporarily to set it as a property of window, so it will be accessible from the console.)
Extras
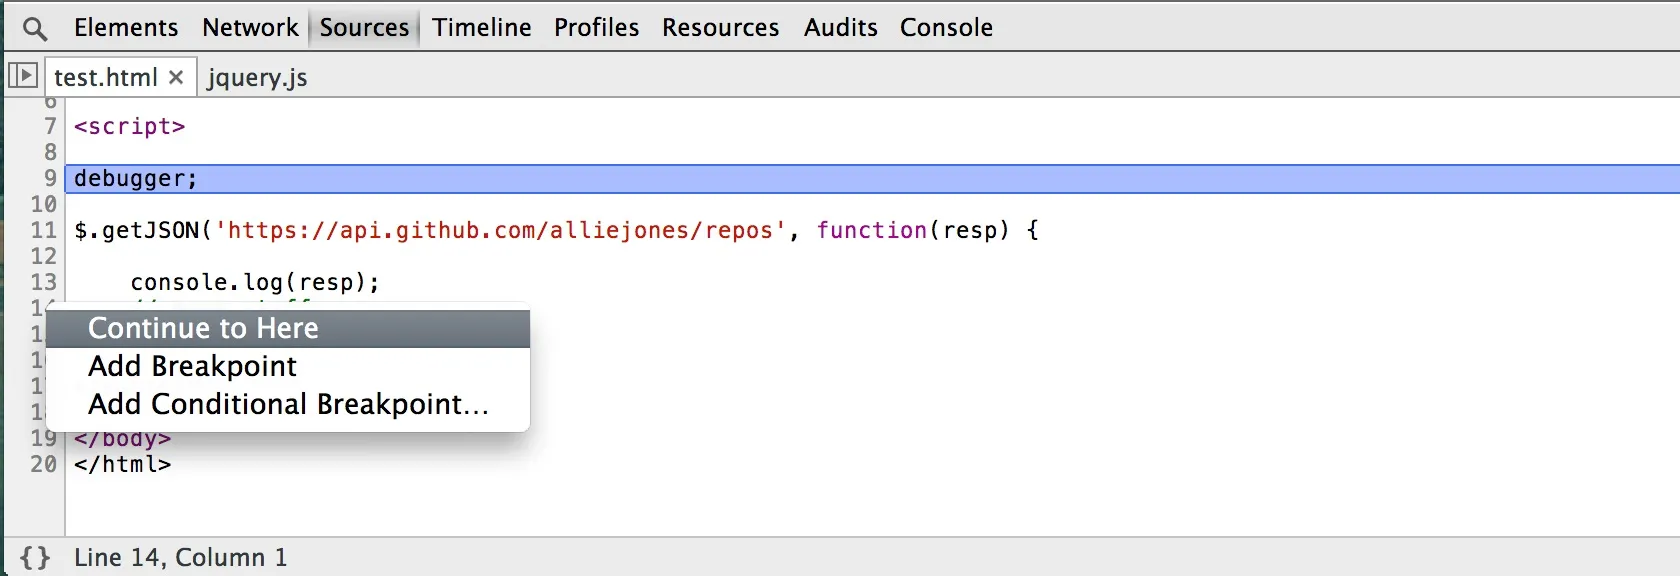
The debugger keyword is incredibly useful, and often better than using console.log (though I use that often, too) or trying to set breakpoints in large files. It will pause code execution wherever you put it, allowing you to see the current state of the application and step through what is happening.
When paused in the debugger, the “Continue to here” option can be useful for jumping into callback functions (which can be tricky or tedious to do otherwise). That option is available by right-clicking on the line number you’d like to stop at.

console.trace can also come in handy. It is similar to console.log, but prints a stack trace to the console instead of its passed arguments.
More thoughts (and less devtools nerdery) next week!